Apoptosis and necrosis are two completely different forms of apoptosis, which can be distinguished based on differences in morphology, biochemistry, and molecular biology of dead cells. There are many methods for detecting apoptosis, and several commonly used assay methods are described below.
Morphological detection of the first type of apoptosis
According to the inherent morphological characteristics of apoptotic cells, many different methods for detecting apoptosis morphology have been designed.
1 optical microscope and inverted microscope
(1) Unstained cells: The volume of apoptotic cells becomes smaller and deformed, the cell membrane is intact but foaming occurs, and apoptotic bodies are seen in the late stage of apoptosis.
Adherent cells appear to shrink, round, and fall off.
(2) Stained cells: Giemsa staining, Wright's staining, etc. are commonly used. The apoptotic cells are characterized by chromatin condensation, marginalization, nuclear membrane cleavage, chromatin segmentation into massive and apoptotic bodies.
2 fluorescence microscope and confocal laser scanning microscope
The progression of apoptosis is generally judged by the morphological changes of nuclear chromatin as an indicator.
Commonly used DNA-specific dyes are: HO 33342 (Hoechst 33342), HO 33258 (Hoechst 33258), DAPI. The combination of the three dyes and DNA is non-embedded and mainly binds to the AT base region of DNA. Bright blue fluorescence is emitted when excited by ultraviolet light.
Hoechst is a reactive dye that specifically binds to DNA. The stock solution is diluted with distilled water to a concentration of 1 mg/ml. When used, it is diluted with PBS to a final concentration of 2 to 5 mg/ml.
DAPI is semi-permeable and is used for staining of conventional fixed cells. The stock solution is made up to a concentration of 1 mg/ml in distilled water, and the final concentration is generally 0.5 to 1 mg/ml.
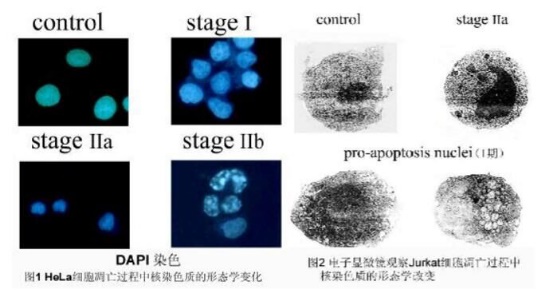
RESULTS: The morphological changes of nuclear chromatin in the process of apoptosis were divided into three phases: the nucleus of stage I was rippled or creased, and some chromatin appeared concentrated; phase IIa nucleus Chromatin is highly coagulated and marginalized; the nuclear cleavage of stage IIb is fragmentation, resulting in apoptotic bodies (Fig. 1).
3 transmission electron microscope observation
Results: The apoptotic cells became smaller and the cytoplasm was concentrated. The chromatin in the nucleus of pro-apoptosis nuclei is highly coiled, and many vacuole structures called cavitation (Fig. 2) appear; the chromatin of the phase IIa nucleus is highly coagulated and marginalized; In the late stage of apoptosis, the nucleus is cleaved into fragments, producing apoptotic bodies.
The second phosphatidylserine analysis (Annexin V method)
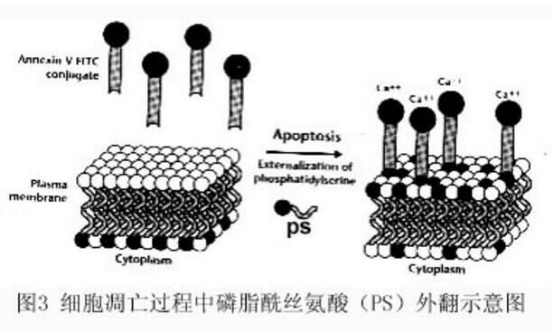
Phosphatidylserine (PS) is normally located inside the cell membrane, but in the early stage of apoptosis, PS can be flipped from the inside of the cell membrane to the surface of the cell membrane and exposed to the extracellular environment (Fig. 3). Annexin-V is a Ca2+-dependent phospholipid binding protein with a molecular weight of 35~36KD, which can specifically bind to PS with high affinity. Annexin-V was labeled with fluorescein (FITC, PE) or biotin, and labeled Annexin-V was used as a fluorescent probe to detect apoptosis by flow cytometry or fluorescence microscopy.
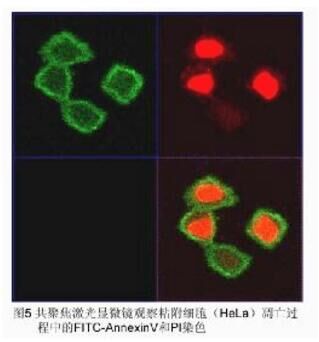
Propidine iodide (PI) is a nucleic acid dye that does not penetrate intact cell membranes. However, in advanced cells and dead cells of apoptosis, PI can pass through the cell membrane to redden the nucleus. Therefore, when Annexin-V is used in combination with PI, cells in early and late apoptotic cells and dead cells can be distinguished.
method
1. Staining of suspension cells: Wash the normal cultured and induced apoptosis cells (0.5~1×10⁶) twice with PBS, add 100ul Binding Buffer and FITC-labeled Annexin-V (20ug/ml) 10ul, avoid at room temperature. After 30 min of light, add 5 ul of PI (50 ug/ml), avoid the light reaction for 5 min, add 400 ul Binding Buffer, and immediately use FACScan for quantitative detection by flow cytometry (generally no more than 1 h), without adding Annexin V-FITC and PI. One tube was used as a negative control.
2. Cell staining of adherent culture: firstly digest with 0.25% trypsin, wash, stain and analyze the same suspension cells.
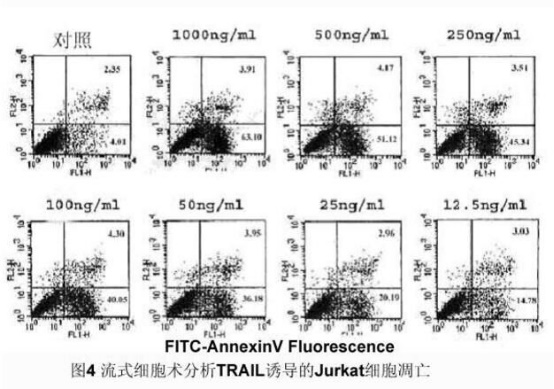
3. Climbing cell staining: Same as above, and finally observed by fluorescence microscope and confocal laser scanning microscope. Results [Fig. 4, Fig. 5]
Precautions
1. The whole operation should be as gentle as possible, do not force the cells.
2. Take care to avoid light during operation and test within one hour as soon as possible after the reaction is completed.
Third detecting mitochondrial membrane potential
Mitochondria play a pivotal role in the process of apoptosis, and a variety of apoptosis stimulating factors can induce apoptosis in different cells, and the decline of mitochondrial transmembrane potential DYmt is considered to be an apoptotic cascade. The earliest event occurred before the appearance of nuclear apoptotic features (chromatin condensation, DNA fragmentation), and once mitochondrial DYmt collapsed, apoptosis was irreversible.
The presence of mitochondrial transmembrane potentials allows some lipophilic cationic fluorescent dyes such as Rhodamine 123, 3,3-Dihexyloxacarbocyanine iodide [DiOC6(3)], Tetrechloro-tetraethylbenzimidazol carbocyanine iodide [JC-1], Tetramethyl rhodamine methyl ester (TMRM), etc. It can be bound to the mitochondrial matrix, and the increase or decrease in fluorescence indicates an increase or decrease in the electronegativity of the mitochondrial inner membrane.
METHODS: Normally cultured cells and apoptosis-inducing cells were added to a final concentration of Rhodamine 123 (1 mM) or a final concentration of DiOC6 (25 nM), JC-1 (1 mM), TMRM (100 nM), 37 癈 equilibrium for 30 min, flow. The cytometer measures the fluorescence intensity of the cells.
Note 1. The pH consistency in the dye solution is always balanced, as changes in pH will affect the membrane potential.
2. If the cell suspension that is in equilibrium with the dye contains protein, they will bind to some of the dye, reducing the concentration of the dye and causing false depolarization.
The fourth DNA fragmentation assay
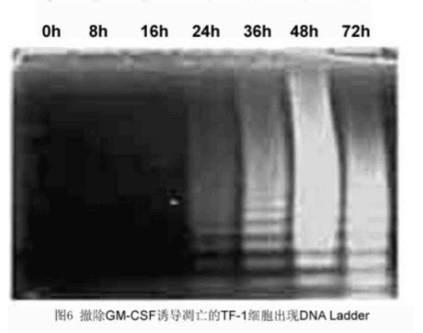
The main biochemical feature of apoptosis is the condensation of chromatin, the cleavage of chromatin DNA at the junction between nucleosome units, the formation of large DNA fragments of 50-300 kbp long, or oligonucleosides of integer multiples of 180-200 bp. The acid fragment appears as a ladder ladder on gel electrophoresis. After the cells were treated, the DNA was isolated and purified by a conventional method, and subjected to agarose gel and ethidium bromide staining, and a typical DNA ladder was observed in the apoptotic cell population. If the amount of cells is small, DNA can be labeled with 32P-ATP and deoxyribonucleotide terminal transferase (TdT) after separation and purification of DNA, followed by electrophoresis and autoradiography to observe DNA ladder in apoptotic cells. form.
1. Determination of DNA fragments of macromolecules
In the early stage of apoptosis, the chromosome breaks into a large DNA fragment of 50-300 kbp. All double-stranded DNA molecules over a certain molecular weight have the same rate of migration in an agarose gel. When the double helix radius of the linear DNA exceeds the gel radius, the resolution limit is reached. At this point, the gel no longer sifts the DNA by the molecular weight. The DNA passes through the gel as if it were bent at one end and pointed to the pole of the electric field. This mode of migration is called "crawling." Therefore, large fragments of 50-300 kbp long DNA generated early in apoptosis cannot be separated by ordinary agarose gel electrophoresis. Pulse electrophoresis is often used to solve this problem satisfactorily. This method is to apply an orthogonal alternating pulse electric field to the gel. Whenever the direction of the electric field changes, large DNA molecules stagnate in the crawler tube until the new electric field is axially reoriented before moving forward. The larger the molecular weight of the DNA, the longer it takes for this rearrangement. When the time in which the DNA molecules change direction is less than the period of the electrical pulse, the DNA can be separated by its molecular weight.
2. DNA Ladder assay
METHODS: Cells were harvested (1'107), and the cell lysate was pelleted at 13,000 rpm for 5 min. The supernatant was collected for 1% SDS and RnaseA (5 mg/ml) at 56 °C.
2h proteinase K (2.5mg/ml) 37 ° C, 2h ~ 1/10 volume of 3M sodium acetate and 2.5 volumes of cold absolute ethanol precipitated DNA, overnight at 4 ° C ~ 14000 rpm '15min, finally dissolved in TE buffer, DNA Loading Buffer, 1.2% agarose gel electrophoresis, EB staining and photography.
Result: [Figure 6]
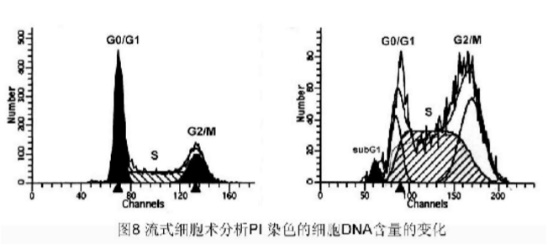
3. Flow cytometry analysis of DNA content in apoptotic cells
Methods: The cells were collected, 70% cold ethanol (in PBS) was fixed at 4 ° C overnight, washed with PBS, 1000 rpm '10 min, RNase A (0.5 mg / ml) was digested at 37 ° C for 30 min, PI (50 mg / ml) stained, room temperature protected from light for 15 min. , FACScan analysis of DNA subdiploid formation and cell cycle changes.
Result: [Figure 8]
4. ApoAlertTM LM-PCR Ladder Assay (CLONTECH)
Advantages: high sensitivity, suitable for detecting a small number of samples, a small number of apoptotic cells. Such as clinical biopsy.
Fifth TUNEL method
In apoptosis, chromosomal DNA double-strand breaks or single-strand breaks produce a large number of viscous 3'-OH ends, which can deoxyribonucleotides and fluorescence under the action of deoxyribonucleotide terminal transferase (TdT). a derivative of peroxidase, alkaline phosphatase, or biotin labeled to the 3'-end of DNA, allowing for the detection of apoptotic cells. Terminal - deoxynucleotidyl transferase mediated nick end labeling (TUNEL).
Since normal or growing cells have almost no DNA breaks, there is no 3'-OH formation and few can be stained. TUNEL is actually a combination of molecular biology and morphology. In situ staining of intact single apoptotic nuclei or apoptotic bodies can accurately reflect the typical biochemical and morphological features of apoptosis. Paraffin-embedded tissue sections, frozen tissue sections, cultured cells, and cells isolated from tissues were assayed for cell morphology, and a very small number of apoptotic cells were detected, and thus were widely used in the study of apoptosis.
Sixth detection of Caspase-3 activity
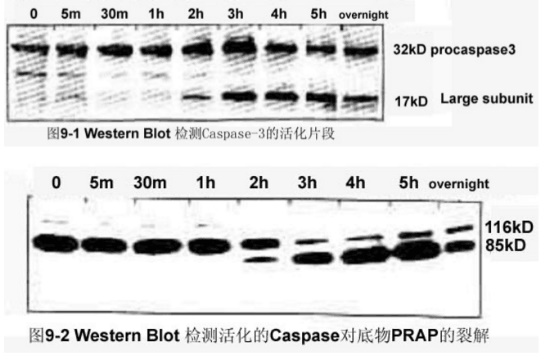
The caspase family plays a very important role in mediating apoptosis, with caspase-3 being a key executive molecule that functions in many pathways of apoptotic signaling. Caspase-3 is normally present in the cytosol in the form of a zymogen (32KD), which is activated in the early stages of apoptosis. The activated Caspase-3 consists of two large subunits (17KD) and two small subunits ( The composition of 12KD) cleaves the corresponding cytosolic nucleus substrate, which ultimately leads to apoptosis. However, in the late stage of apoptosis and death cells, the activity of caspase-3 was significantly decreased.
1. Western blot analysis of Procaspase-3 activation, and activation of Caspase-3 and cleavage of substrate poly(ADP-ribose) polymerase [PARP].
method:
Collect cells→PBS wash→extract cell lysate→protein quantification→SDS-PAGE electrophoresis→nitrocellulose membrane or PVDF membrane transfer→5% skim milk powder blocking, room temperature 1.5~2h or 4°C overnight→Caspase-3 polyclonal antibody or Monoclonal antibody reaction at room temperature for 1~2h or 4°C overnight→TBS-T (TBS containing 0.05% Tween 20) for 3 times, 5~10min/time→HRP-labeled goat anti-mouse IgG or AP-labeled goat anti-mouse IgG Room temperature reaction 1~2h→ TBS-T wash 3 times, 5~10min/time→ECL development or NBT/BCIP color development.
Result: [Fig. 9-1, 9-2]
2, fluorescence spectrophotometer analysis
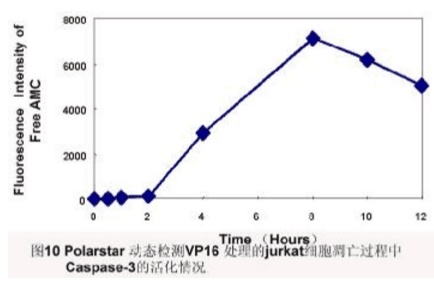
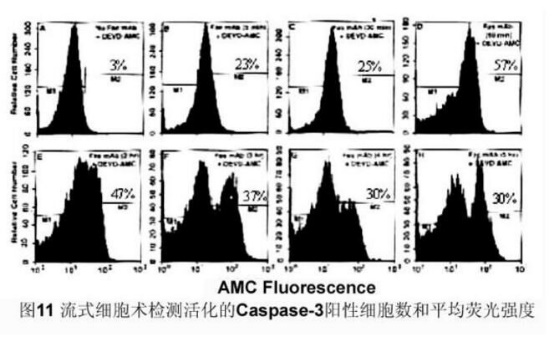
Principle: Activated Caspase-3 specifically cleaves the D1E2V3D4-X substrate and hydrolyzes the D4-X peptide bond. According to this feature, a short peptide Ac-DEVD-AMC coupled with a fluorescent substance was designed. In covalent coupling, AMC cannot be excited by fluorescence, and short peptides are hydrolyzed to release AMC, and free AMC can be excited to emit fluorescence. Based on the magnitude of the released AMC fluorescence intensity, the activity of caspase-3 can be determined to reflect the extent to which Caspase-3 is activated.
METHODS: Normal or apoptotic cells were harvested, washed with PBS, cell lysate was prepared, Ac-DEVD-AMC (caspase-3 tetrapeptide fluorescent substrate) was added, and reaction was carried out at 37 ° C for 1 h. Fluorescence spectrophotometer (Polarstar) was used to analyze fluorescence intensity. (Excitation light wavelength 380 nm, emission light wavelength 430-460 nm).
Result: [Figure 10]
3, flow cytometry analysis
METHODS: Normal or apoptotic cells were harvested, washed with PBS, and reacted with Ac-DEVD-AMC at 37 °C for 1 h. The number of caspase-3 positive cells and the mean fluorescence intensity were analyzed by UV flow cytometry.
Result: [Figure 11]
Expression and cellular localization of the seventh apoptosis-related protein TFAR19
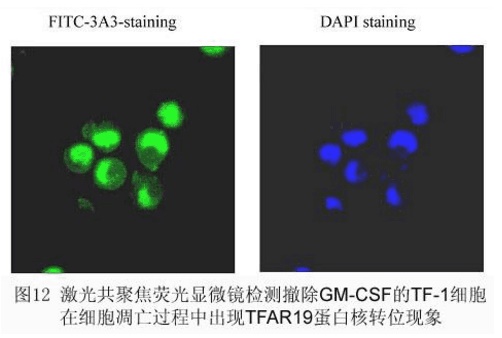
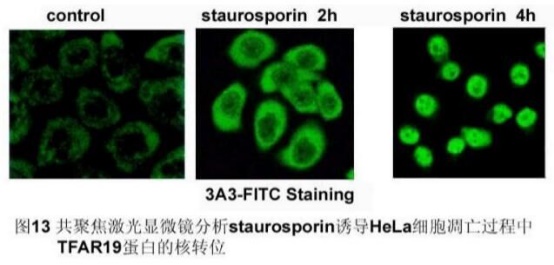
TFAR19 (PDCD5) is a new human gene with its own intellectual property first reported by the laboratory in the world. The preliminary functional studies show that it is an enhancer for promoting apoptosis. Using fluorescein (FITC)-labeled TFAR19 monoclonal antibody as a probe, the expression level and localization of TFAR19 protein during apoptosis showed that the expression of TFAR19 was increased and a rapid nuclear translocation occurred with the nucleus. Morphological changes persist for a long time and are still visible in apoptotic bodies. At the same time, we found that the nuclear translocation of TFAR19 protein in early stage of apoptosis is earlier than phosphatidylserine (PS) valgus and fragmentation of nuclear DNA, suggesting that nuclear translocation of TFAR19 protein is one of the earlier events of apoptosis. Further studies have shown that the nuclear translocation of TFAR19 in early stage of apoptosis has universal significance, and high expression of TFAR19 and nuclear translocation occur in early stage of different cell apoptosis. This provides a new technique and indicator for studying events that occur early in apoptosis. Cellular localization analysis of TFAR19 protein
Material reagents:
FITC-labeled monoclonal antibody, pH 7.4, 0.15 Mol/L PBS, 3% paraformaldehyde, PBS-T (pH 7.4, 0.15 Mol/L PBS containing 0.2% Tween 20), fetal bovine serum, fluorescent cells Lotion: pH 7.4, 0.15 Mol/L PBS containing 2% fetal bovine serum and 0.1% NaN3. FACS tube, Tip head, pipette.
Instruments: cryogenic horizontal centrifuge, 37 ° C water bath, fluorescence microscope, confocal laser scanning microscopy, flow cytometry
method:
1. Staining of suspended cells;
(1) Harvest normal and apoptotic cells (0.5~1'106), wash twice with PBS, 1000 rpm '10 min.
(2) 3% paraformaldehyde ice bath for 10 min, PBS wash twice, 1000 rpm '10 min.
(3) Add PBS-T solution, incubate at 37 ° C for 15 min, wash twice with PBS, 1000 rpm '10 min.
(4) Add 200 ml fetal calf serum and react at room temperature for 30 min.
(5) Add 5ml FITC-labeled TFAR19 monoclonal antibody (final concentration 1:40), 4癈 reaction for 30min
(6) Fluorescent cell wash was washed twice, 1000 rpm '10 min.
RESULTS: The cell pellet was centrifuged, and the localization of TFAR19 in the cells was observed under fluorescence microscope and confocal laser microscope. At the same time, the average fluorescence intensity of TFAR19 protein was quantitatively detected by flow cytometry. [Fig. 12]
2. In situ staining of adherent cells;
(1) The log phase cells of adherent growth are plated in 24-well or 6-well plates (with clean coverslips inside), allowing them to grow and grow until 50% to 80% full, apoptosis inducer Treat cells.
(2) The cells treated at different time points were subjected to immunofluorescence staining, and the staining procedure was the same as above.
(3) The stained cells were placed on a glass slide with a small amount of glycerol (5 ml), and the localization of TFAR19 in the cells was observed by fluorescence microscopy or confocal laser scanning microscopy.
Observation of results: [Fig. 13]
3. Staining and detection of clinical pathological sections;
4. Culture and detection of primary cells;
5. Analyze the distribution and localization of TFAR19 protein in various tissues and organs in human body. Expression of TFAR19 protein and clinical disease
1. ELISA was used to detect TFAR19 protein levels and TFAR19 autoantibody levels in normal humans and disease states, as well as at different stages of the disease.
Materials and reagents:
1. Coated Buffer: pH9.6, 0.05Mol/L carbonate Buffer
2. Washing solution: pH 7.4, 0.15Mol/L PBS with 0.05% Tween 20
3. Blocking solution: 3% BSA (prepared with washing solution)
4. Dilution of the enzyme-labeled antibody: diluted with blocking solution 5. OPD substrate Buffer: Na2HPO4.12H2O 1.84g
Citric acid 0.51g
DDW 100ml
6. Coloring solution (currently available): Substrate Buffer 10ml
OPD 2mg
30% H2O2 2ml
7. Stop solution 2Mol/L H2SO48. Recombinant human TFAR19, HRP-labeled goat anti-human IgG9. ELISA plate, Tip, pipette, ELISA Reader (OD490nm), plate washer
Procedure 1. Incubate the ELISA plate with recombinant human TFAR19 (1 mg/ml) diluted with Buffer, incubate at 100 ml/well, incubate at 37 °C for 2 h or 4 °C overnight (generally 24 h or more).
2. Wash Buffer three times, add blocking solution, 200 ml/well, incubate at 37 °C for 2 h or 4 °C overnight.
3. Wash Buffer three times, add different dilutions of patient serum (3 replicate wells) 100ml/well, incubate for 1h at 37 °C. The Buffer, the washing Buffer and the blocking solution were set as negative controls.
4. Wash the Buffer plate three times, add 1:2500 diluted HRP-labeled anti-human IgG, 100 ml/well, and incubate for 1 h at 37 °C.
5. Wash the Buffer and wash the plate three times. Add the coloring solution, 100 ml/well, and avoid the light reaction for 10~15min.
6. Stop the reaction by adding H2SO4, 50 ml/well.
7. ELISA Reader reads OD490 optical density values ​​and analyzes and compares the expression levels of TFAR19 autoantibodies in patient serum and normal serum.
2. Western blot analysis of the expression levels of TFAR19 protein in primary tumor cells and normal cells.
About Europe
Nanjing Ouji Medical Service Co., Ltd. is a technology-based company specializing in drug R&D service outsourcing and translational medicine research. It was founded by a group of doctors returning to study abroad and has key technologies for innovative drug research and translational medicine research.
1 European Medicine is the editor-in-chief of Asia-Pacific Division of Epigenetic Diagnosis & Therapy magazine, Bentham Science Press, USA
2 “Medical Innovation Technology Transfer Service Platform†in Gulou District, Nanjing, which is a gathering of well-known hospitals and medical colleges.
3 Ouji Medicine has successfully carried out research on outsourcing services for more than 100 pharmaceutical companies, hospitals, biotechnology companies and universities at home and abroad, and has won wide acclaim from domestic and foreign customers.
4 The European medical doctors were supported by the “Double Invasive†program of Jiangsu Province, the “Enterprise Doctoral Program†of Jiangsu Province, the Nanjing Science and Technology Commission's Nanjing Science and Technology Talents Innovation and Entrepreneurship Project Support, and the Nanjing International Service Outsourcing Public Platform Construction Project Support. Special support for the cultivation of science and technology entrepreneurs in the Gulou District Science and Technology Bureau.
China Extract Powder For Use As Dietary Supplement Extract Powder, Extract Powder Manufacturer
Shaanxi Kang New Pharmaceutical co., Ltd. , https://www.bio-pharmacies.com