Rapid and sensitive determination of multiple veterinary drug residues in meat, plasma and milk using the Q Exactive Focus LC/MS system
Olaf Scheibner, Maciej Bromirski, Thermo Fisher Scientific, Bremen, Germany
Key words
Q Exactive Focus, Orbitrap, Veterinary Drugs, HRAM Quantification, HRAM Screening, vDIA, Unknown Screening, Retrospective Data Analysis
purpose
This experiment used variable data non-dependent acquisition (vDIA) to establish a new method for veterinary drug analysis. The method is highly sensitive and selective, provides comprehensive and high-quality data for the sample being tested, and combines quantitative analysis with non-target and unknown screening.
introduction
Considering the complexity of sample pretreatment and mass spectrometry, veterinary drug residue analysis in animal-derived foods is often a time consuming process. Quantitative analysis of multiple veterinary drug residues in animal-derived foods (including meat, milk, and plasma) using traditional methods often requires multiple injections to obtain optimal analytical conditions for each component, including differences for different types of compounds. Chromatography and mass spectrometry methods. And the data obtained only contains information on the target compound, and is not suitable for retrospective analysis of other compounds.
This experiment established a new method using ultra-fast liquid chromatography and the Thermo ScientificTM Q Exactive FocusTM benchtop OrbitrapTM mass spectrometry system, which includes a flash chromatography method and a variable data-independent acquisition (vDIA) mass spectrometry method. The method has the advantages of short analysis time, high selectivity and high sensitivity, and the data collected can be used for other target and non-target screening. This experiment uses the vDIA method to create a standard curve and analyzes known and unknown target compounds in the sample. vDIA allows multiple MS/MS isolation windows to be set up with window widths from 50Da to 800Da. Typically smaller window widths are used for low quality areas to extend dynamic range and sensitivity, and larger window widths are used for higher quality areas to improve duty cycle. The typical method setup for this method is as shown herein, covering the entire mass range of the full scan with 5 sets of MS/MS isolation windows while maintaining the MS/MS analysis speed matched to the flash chromatographic separation.
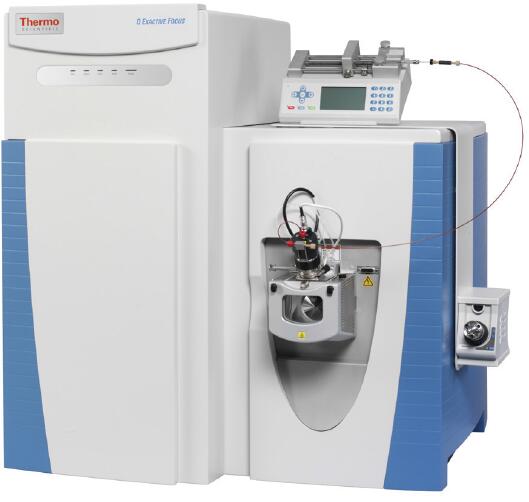
Figure 1 Q Exactive Focus Benchtop Orbitrap Mass Spectrometer
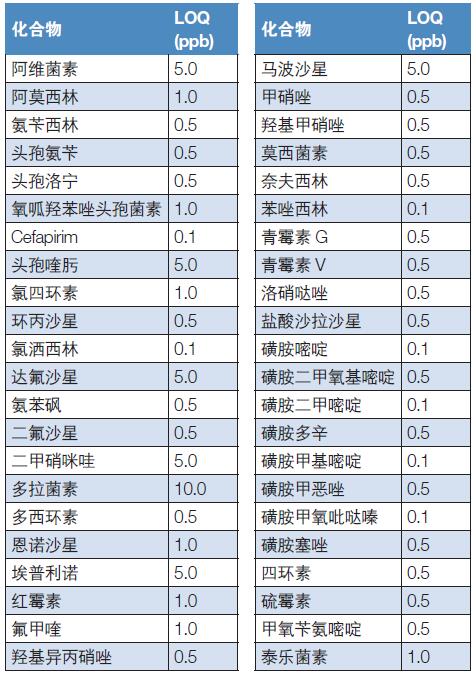
As shown in Table 1, the analyzed components were 44 different types of veterinary drug residues, and the analyzed samples included muscle, kidney, milk, and plasma extracts, all of which were analyzed using the same standardized chromatography and mass spectrometry methods. For absolute quantitative analysis, 44 concentrations of known animal residue standards were formulated into 8 different concentrations of standard solutions (from 100 pg/mL (ppt) to 500 ng/mL (ppb)). High-resolution, high-quality (HRAM) LC-MS/MS method was used to analyze matrix spiked samples (antibiotic standards were added to muscles and kidneys, avermectin standards were added to milk, and imidazole nitrate was added to plasma. Standard)) by evaluation method.
Table 1 Target compounds and their limit of quantitation (LOQ)
experimental method
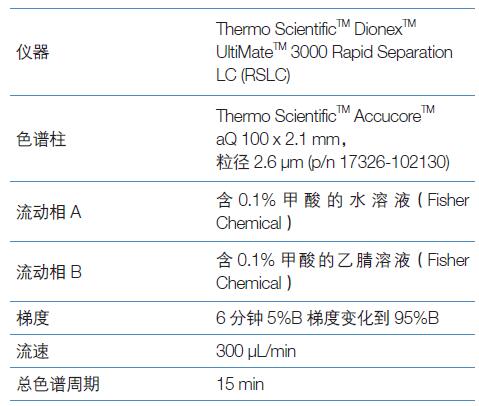
Liquid chromatography
All samples were subjected to the following liquid chromatography methods:
Mass spectrometry
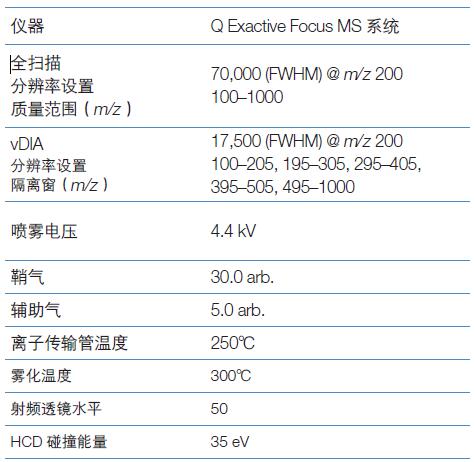
The mass spectrometry method uses a variable data independent acquisition (FS-vDIA) method with full scan and wide isolation window:
Data processing method
Data processing using Thermo ScientificTM TraceFinderTM version 3.2 software. The extracted ion chromatogram was extracted using a 5 ppm extraction window. For non-target screening, a database of 450 components with various components and their fragment m/z values ​​is built into the library.
The quantification of the analyte is based on full scan information (excimer ions). In addition, according to EU regulatory requirements (EC/657/2002), 1 to 5 fragment ions are used for qualitative confirmation, and a linear standard curve is obtained over the above concentration range.
The vDIA method described in this article combines full scan data with MS 2 (FS-ddMS 2 ) and full-range fragment scan modes (such as all ion fragmentation AIF mode). As shown in Figure 2, it combines a full scan and MS 2 scans of a wide range of isolated windows. In this setup, the width of the MS 2 isolation window varies from 100 Da to 500 Da, and several isolation windows collectively cover the entire mass range of the previous full scan.

Figure 2. A typical FS-vDIA experiment setup
Method 2 Scan the MS 2 FS-ddMS title compound is detected in full scan (parent ion in the list) for scanning the MS 2, the information available to fragment ions with high selectivity and sensitivity. For other compounds of interest, retrospective data analysis of the FS-ddMS2 method is based solely on accurate mass-quantity full-scan quantification due to the lack of qualitative confirmation of MS/MS.
The full-range fragment scanning mode, such as AIF, detects fragments of all compounds in a full scan in an MS 2 scan. The advantage is that all possible full scan and MS 2 scan information in the sample can be acquired, so this method is especially suitable for Retrospective data analysis. However, due to the complexity of the analyte itself, the number of fragment ions of each compound is limited. Therefore, the dynamic range, selectivity and detection limit of the method have certain limitations.
In the vDIA method, fragment ions are distributed across multiple wide-range isolation windows that cover the complete mass range. The method is highly sensitive and selective, while maintaining the integrity of the sample information, making it ideal for retrospective data analysis. The limits of quantitation (LOQs) in Table 1 were quantified by full-scan quantification in a step-by-step dilution method and qualitatively confirmed in combination with fragment ions. The limit of quantitation is defined herein as the minimum compound concentration that can be qualitatively confirmed by at least one fragment ion.
For accurate quantification and qualitative confirmation, the fragment ions used for qualitative confirmation need to be fully resolved in terms of retention time and mass number to avoid being affected by elevated background or interference peaks. Figure 3 illustrates the high degree of overlap and matching of the ion chromatograms extracted from the qualitative fragment ions (right panel) and the quantitative parent ions using the vDIA scan mode and TraceFinder software. All qualitative ions are undisturbed and flow out simultaneously with the quantified ions, making qualitative conclusions unquestionable, which is especially important for the analysis of complex matrix samples. In vDIA mode, the contour map of all co-eluting fragments can be obtained, so the integration of the fragment peaks and the calculation of the fragment ion ratio can also confirm the qualitative results more reliably.
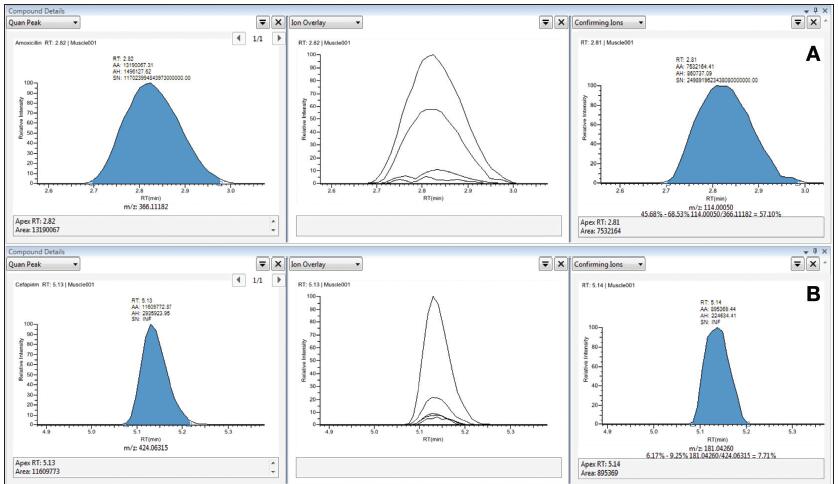
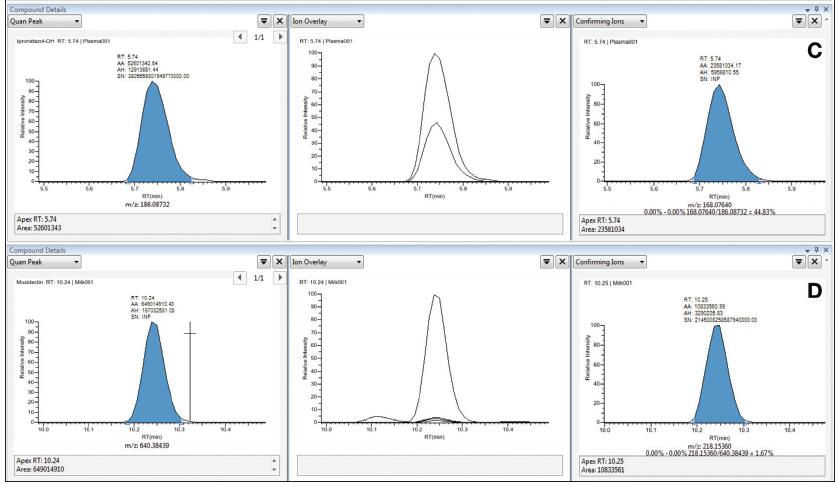
Figure 3. Selectivity of selected compounds in the matrix: A. Add 5 ppb of ampicillin to pork; B. Add 5 ppb of sulfadiazine to pig kidney; C. Add 1 ppb of nitroxazole to pig blood; D. Add 1 ppb of milk to milk Streptomycin.
Figure 4 shows the linear dynamic range of the selected components in the vDIA scan mode. The standard curve ranges from 0.5 ppb to 500 ppb, and all linear correlation coefficients R2 are greater than 0.99.
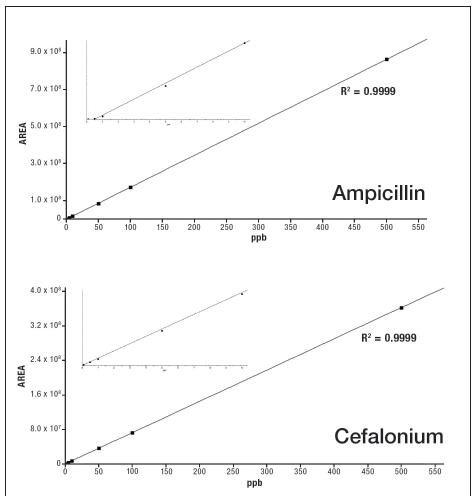
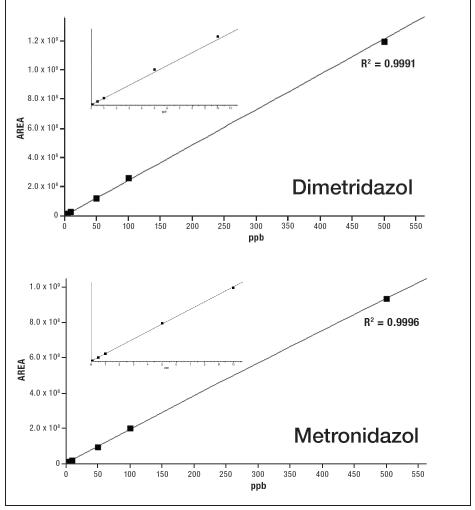
Figure 4. Linearity of selected compounds
For avermectin and doramectin, experiments have found that excimer ions are not stable, so the sensitivity of full scan detection is not high. This instability may be due to the average parameters of the general method. In this case, the vDIA method can be quantified using several fragment ions of avermectin and doramectin. In this mode, even if the ion concentration is much lower than the excimer compared to the full scan mode. The ion concentration also enables reliable quantitative and qualitative confirmation.
After the quantitative curve was established, all components in the low concentration matrix spiked samples were quantitatively analyzed. 5 ppb antibiotics were added to the muscle and kidney samples, 1.0 ppb avermectin was added to the milk, and 1.0 ppb nitroimidazole veterinary drug was added to the plasma.
In the analysis of full scan recognition with retention time, TraceFinder processing software provides high selectivity for component detection (using a 5 ppm narrow extraction window). The software also offers three additional automated qualitative confirmation methods. The first way is to confirm the isotope information of the parent ion in the full scan. Figure 5 is an overlay of the isotope distribution of ciprofloxacin measured (red) and theoretical (blue). By setting the resolution to 70,000, even in a complex matrix such as a muscle extract, the concentration of a compound is as low as 5 ppb, and the isotope distribution is not disturbed, ensuring the reliability of qualitative results.
The second way is to qualitatively confirm the known fragment ions by MS/MS data. The following results are the results of a 0.5 ppb muscle tissue plus standard. Figure 6 shows the results of fragment ion verification in vDIA mode. Since the vDIA spectrum is generated using a wide isolation window, it is possible to detect fragment ions generated by multiple parent ions. The high resolution and high quality accuracy of the Orbitrap MS/MS makes it possible to selectively identify fragment ions, combined with retention times for reliable and reliable results.
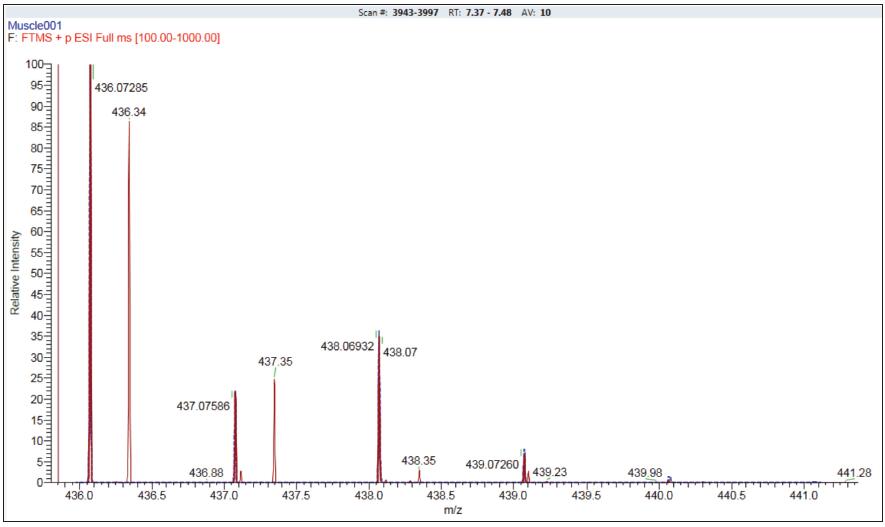
Figure 5. Isotope pattern matching of ciprofloxacin, red is the measured spectrum, blue is the theoretical isotope distribution
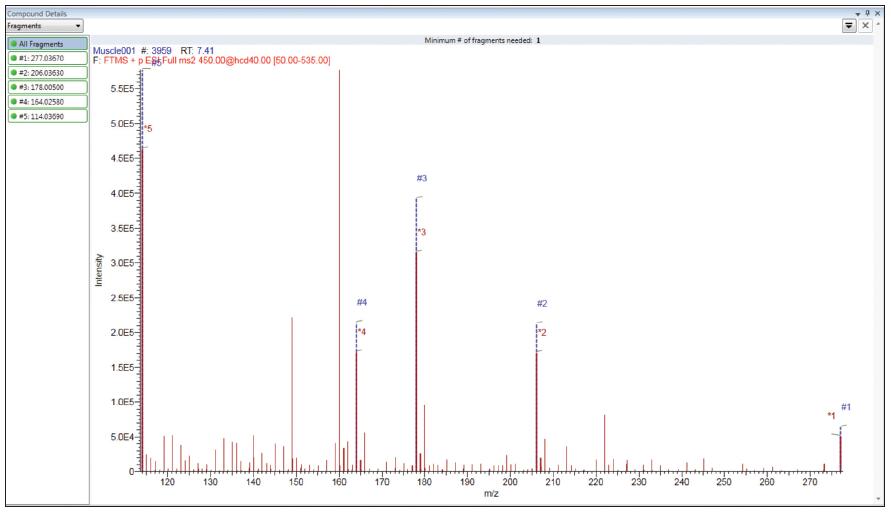
Figure 6. Fragment matching results for ciprofloxacin, red for the measured spectrum and blue for the fragment ion mass
The number of target compounds that can be analyzed by most conventional methods is limited. Therefore, the ability to re-analyze the candidate drug for "post-mass spectrometry" is beneficial to save instrument/experiment time and samples. To demonstrate a retrospective analysis of the data files, a wide-range screening of vDIA data files for spiked samples of muscle tissue was performed. Using the built-in 1500 compound database for unknowns screening, it was found that some of the results in the database were highly matched to the other components present in the sample. Figure 7 shows cortisol (hydrocortisone) as an example, demonstrating the results of confirmation by isotope matching, fragment search and library matching.
in conclusion
In this paper, a variable data-independent acquisition method for 44 different types of veterinary drug residue screening was established using Q Exactive Focus MS and UltiMate 3000 HPLC. The new method satisfies the required LOD sensitivity and is qualitatively identifiable based on retention time, precise m/z, isotope ratio and fragment ions, and performs better than EU regulatory requirements (EC/657/2002). vDIA provides a new method for screening confirmation of non-target compounds and unknowns with high sensitivity and selectivity. TraceFinder software is easy to use and can be applied throughout the process of compound identification and qualitative confirmation. The vDIA method achieves the desired goal of accurately and sensitively detecting non-target compounds (eg, substances in the 44 component list) and allowing retrospective analysis of unknown compounds.
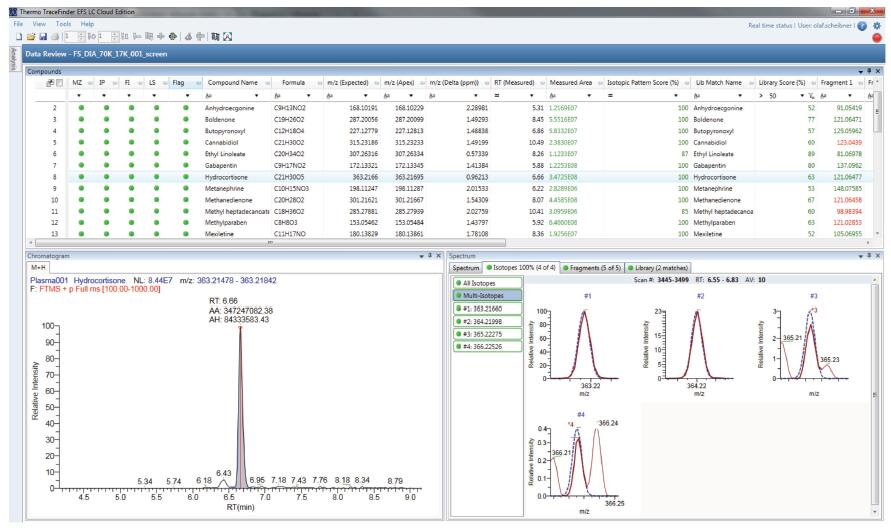
Figure 7. Non-target screening results for TraceFinder software
Stainless Steel Triclover Clamp,Steel Triclover Clamp,Stainless Steel Solid End Cap,Stainless Steel Tank
Wenzhou Gaoya Light Industry Machinery Co.,ltd. , https://www.hongyafitting.com